Indo-Marine-Base
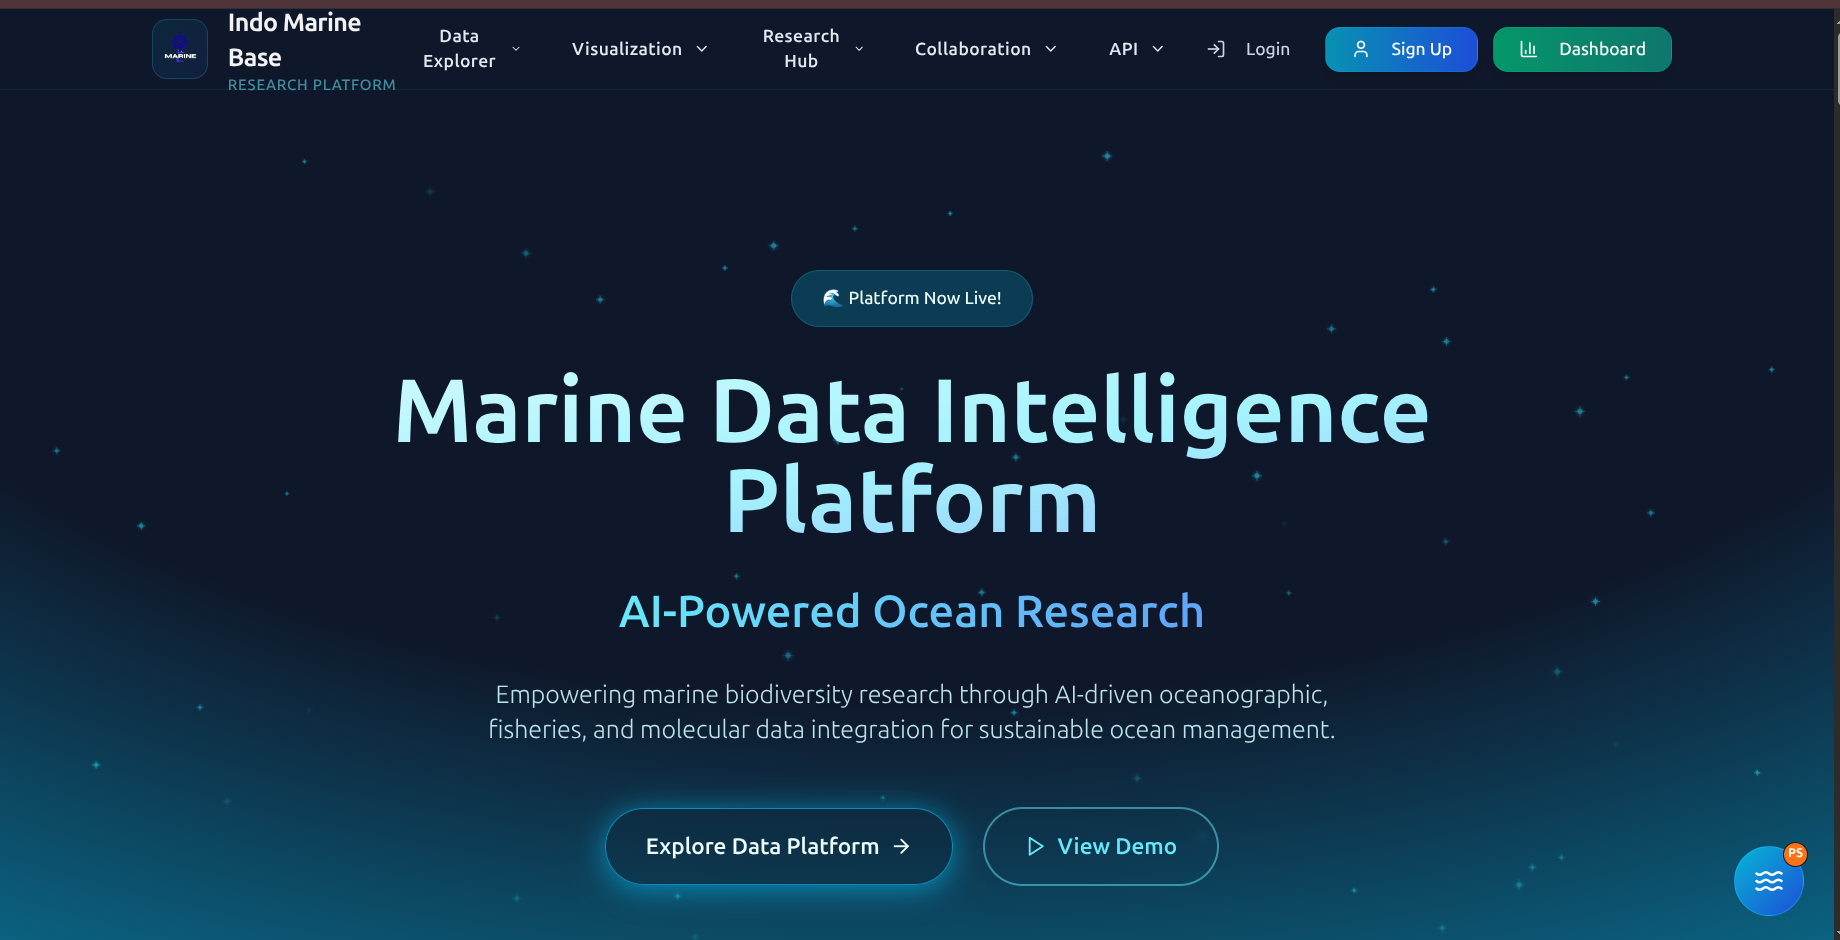
A full-stack React SPA serving as an open-access scientific research portal for Indian Ocean marine biodiversity. Features interactive Leaflet + Mapbox GL cartographic maps, biodiversity analytics, AI research tools, Tableau-embedded dashboards, marine species database, vessel route planning, dataset management with multi-format export (CSV/Excel/PDF), and a full admin panel — deployed live on Netlify.
Problem Statement
Marine biodiversity data for the Indian Ocean is scattered across disconnected scientific databases, government portals, and research institutions — with no unified interface for researchers to explore, visualize, and cross-reference it. Existing tools require specialized GIS software (ArcGIS, QGIS) just to view species distribution maps, and there is no platform that combines ocean parameter data (temperature, salinity, pH), species records, research publications, vessel route planning, and AI-assisted analysis in a single accessible web interface. Researchers waste hours switching between tools, exporting CSVs manually, and rebuilding the same visualizations for every report.
Solution
Built a comprehensive React SPA with 26 distinct routes covering every dimension of marine research workflow. The platform unifies interactive cartographic mapping (Leaflet + Mapbox GL with 5 specialized map components), biodiversity analytics (D3 + Recharts + simple-statistics), AI research tools (largest page at 41KB), Tableau-embedded professional dashboards, a marine species database, a dataset catalog with multi-format export (CSV, Excel, PDF via jsPDF + html2canvas), vessel route planning, and a full admin panel. A globally persistent floating Problem Statement bubble keeps the research mission visible on every page. The entire platform is a zero-backend, client-side SPA — deployed instantly on Netlify with SPA redirect rules, accessible to any researcher worldwide without login requirements for core features.
Code Structure
Indo-Marine-Base/
├── index.html                        # SPA entry
├── netlify.toml                      # SPA redirect: /* → /index.html
├── vite.config.js                    # Vite + React SWC plugin
├── tailwind.config.js                # Custom theme + ocean color palette
├── postcss.config.js
├── eslint.config.js
├── package.json                      # 65+ production dependencies
│
├── public/                           # Static assets: datasets, images, icons
│
└── src/
    ├── main.jsx                      # React entry + global styles
    ├── App.jsx                       # Router + 26 routes + providers
    ├── App.css                       # Global CSS (12.7KB)
    ├── index.css                     # Tailwind base + CSS variables
    │
    ├── pages/                        # 26 route-level pages
    │   ├── AdminDashboard.jsx        # 59KB — largest: full admin panel
    │   ├── AITools.jsx               # 41KB — AI research hub
    │   ├── ProblemStatement.jsx      # 41KB — detailed research PS
    │   ├── Datasets.jsx              # 40KB — dataset catalog + downloads
    │   ├── Visualization.jsx         # 31KB — multi-chart suite
    │   ├── ProjectReport.jsx         # 24KB — full project report
    │   ├── Projects.jsx              # 22KB — research projects
    │   ├── Profile.jsx               # 21KB — user profile
    │   ├── DataExplorer.jsx          # 20KB — interactive data explorer
    │   ├── AIShowcase.jsx            # 20KB — AI features showcase
    │   ├── Documentation.jsx         # 20KB — platform docs
    │   ├── Collaborations.jsx        # 20KB — research collaborations
    │   ├── TableauDashboard.jsx      # 19KB — Tableau embeds
    │   ├── Outreach.jsx              # 19KB — community outreach
    │   ├── SpeciesDatabase.jsx       # 17KB — marine species catalog
    │   ├── Register.jsx              # 17KB — user registration
    │   ├── Home.jsx                  # 16KB — main dashboard
    │   ├── ResearchTools.jsx         # 16KB — research tools
    │   ├── APIAccess.jsx             # 16KB — API docs + access
    │   ├── Publications.jsx          # 16KB — scientific publications
    │   ├── Contact.jsx               # 14KB — contact form
    │   ├── About.jsx                 # 10KB — about page
    │   ├── Login.jsx                 # 9.7KB — authentication
    │   ├── Index.jsx                 # 904B — landing splash
    │   └── NotFound.jsx              # 739B — 404 page
    │
    ├── components/
    │   ├── BiodiversityAnalytics.jsx # 27KB — full analytics suite
    │   ├── RoutePlanning.jsx         # 21KB — vessel route planner
    │   ├── TimeSeriesAnalytics.jsx   # 19KB — time series charts
    │   ├── MapControls.jsx           # 16KB — map layer controls
    │   ├── SystemArchitectureDiagram.jsx # 13KB — interactive xyflow diagram
    │   ├── RouteManager.jsx          # 12KB — route management
    │   ├── InteractiveMap.jsx        # 8.6KB — base Leaflet map
    │   ├── AppSidebar.jsx            # 6.8KB — sidebar navigation
    │   ├── TableauEmbed.jsx          # 4.9KB — Tableau wrapper
    │   ├── BiodiversityMap.jsx       # 4.9KB — species map
    │   ├── TopNav.jsx                # 4.2KB — top navigation
    │   ├── OceanParametersMap.jsx    # 3.6KB — ocean params overlay
    │   ├── Layout.jsx                # 3KB — admin route wrapper
    │   ├── TemperatureHeatMap.jsx    # 1.9KB — heat map layer
    │   ├── ProblemStatementBubble.jsx # 1.3KB — global floating widget
    │   ├── APIAccess/                # API sub-components
    │   ├── HeroSection/              # Landing hero sub-components
    │   ├── Visualization/            # DataVisualizationTool component
    │   ├── navigation/               # Navbar.jsx + Footer.jsx
    │   └── ui/                       # Full shadcn/ui (25+ Radix primitives)
    │
    ├── hooks/                        # Custom React hooks
    └── lib/                          # cn() utility + helpers
Key Strategies
Specialized map component per data type
Instead of one overloaded map component, five dedicated map components each handle one concern — biodiversity markers, ocean parameters, temperature heat, route planning, and base interaction — keeping each under 9KB and easily maintainable
Zero-backend static-first architecture
All data is static (public/ directory) + client-side parsed (PapaParse/XLSX/xml2js) — eliminates all server costs and deployment complexity; entire platform deploys as a Netlify static build in under 2 minutes
Multi-format data export pipeline
Researchers need data in the format their tools accept — CSV (Python/R), Excel (Excel users), PDF (reports); building all three into a single export UI using client-side libraries (json2csv, xlsx, jsPDF) covers every researcher workflow without a backend
Global floating research context widget
ProblemStatementBubble renders outside the route tree — always visible regardless of which of the 26 pages a user is on — keeping the platform's scientific mission statement a single click away at all times
Interactive architecture diagram as documentation
SystemArchitectureDiagram.jsx uses React Flow (xyflow) to render the platform's own architecture as a draggable, interactive node diagram inside the app itself — documentation that lives with the product, not in a separate wiki
TanStack Query for all async state
Even in a static-data app, TanStack Query provides loading states, error boundaries, and automatic caching that make the UX feel as responsive as a real API-backed app — data appears instant on revisit due to stale-while-revalidate behavior
Technical Challenges
Performance Decisions
- Zero backend = zero cold starts — entire platform served from Netlify CDN edge nodes globally
- TanStack Query v5 caches all data fetches client-side — repeated dataset loads hit memory, not disk
- Vite SWC build (typescript-eslint + @vitejs/plugin-react-swc) — significantly faster transpilation than Babel
- Leaflet lazy-renders only visible map tiles — map performance stays smooth even with heavy overlay layers
- react-intersection-observer drives all scroll animations — elements only animate when entering viewport, never off-screen
- GSAP + Lenis smooth scroll — hardware-accelerated, 60fps guaranteed on modern browsers
- Multi-format export (CSV/Excel/PDF) runs entirely client-side — no server round-trip, no file upload
- Static datasets in public/ served directly by Netlify CDN — PapaParse streams large CSVs without blocking the main thread
- shadcn/ui components are tree-shaken by Vite — only imported Radix primitives are bundled
Trade-offs Made
All data is static — cannot accept real user submissions or store user data persistently without an external service
Two map libraries increase bundle size significantly
Heavy bundle weight; in production a single animation library would suffice
Dependent on Tableau Public availability; embeds can be slow to load; no control over Tableau's styling
Manual installation per component; more upfront setup
Overkill for a static-data app; adds bundle size for a use case that could be simpler
html2canvas captures the DOM as a raster image — PDF quality is lower than server-side PDF generation; complex layouts can break
Lessons Learned
-
Bundle size discipline matters from day one. This project has 65+ dependencies including 4 animation libraries and 2 map libraries. In a production app, you'd audit bundle size with vite-bundle-visualizer before adding any major library. The lesson: always check bundle impact before installing.
-
Static-first architecture has hidden scaling walls. A pure SPA with no backend works beautifully for read-only research data. The moment you need real user-generated content (research submissions, comments, data uploads) you hit a wall — you need a backend service. Plan for this inflection point before it arrives.
-
Multiple visualization libraries create inconsistency. Using D3, Recharts, and Tableau in the same app means three different rendering paradigms, three different APIs, and three different visual styles. A unified charting decision at project start would produce a more cohesive UI.
-
react-hook-form + Zod is the correct form stack. Every form in this project (Login, Register, Contact, Profile) uses this combination — it handles validation, error display, and submission state with minimal boilerplate. This is now a permanent pattern in my toolkit.
-
Netlify SPA redirect configuration is non-optional. Without netlify.toml setting /* to /index.html, every direct URL to a page returns a 404 on Netlify. This is a day-one requirement for any SPA deployment — not a post-launch fix.
-
The ProblemStatementBubble pattern is underrated. A globally persistent floating widget that keeps the core mission statement accessible on every page improved user orientation significantly. Any platform with a complex navigation structure benefits from a single persistent "why are we here" anchor point.
Future Improvements
- Supabase backend integration — move user auth (Login/Register) from client-side mock to real Supabase Auth, and store user profiles, saved routes, and research bookmarks in Supabase PostgreSQL
- Real marine API integrations — OBIS (Ocean Biodiversity Information System), GBIF, NASA Earthdata, NOAA CoralWatch APIs for live species and ocean parameter data instead of static datasets
- Bundle size audit — vite-bundle-visualizer pass to identify and eliminate duplicate/unused dependencies; consolidate to 2 animation libraries maximum
- Server-side PDF generation — replace jsPDF + html2canvas with a serverless function (Netlify Function) calling Puppeteer for production-quality PDF exports
- Offline support — Service Worker + Workbox for offline-first research access; marine researchers may work in areas with limited connectivity
- Real-time collaboration — Supabase Realtime channels for multi-researcher collaboration on route planning and data annotation
- i18n support — react-i18next for multilingual support; Indian Ocean research communities span India, Indonesia, East Africa, and the Middle East
- Mapbox 3D ocean floor visualization — Mapbox GL terrain + bathymetry data for 3D ocean floor depth mapping
Security Considerations
- Pure client-side SPA — no server, no database, no API keys in server environment; attack surface is limited to XSS and supply chain
- No sensitive data stored client-side — LocalStorage used only for UI preferences, never for user credentials or research data
- Zod validation on all forms — all user inputs (Login, Register, Contact) are schema-validated before any processing
- React Router v6 route protection — admin route (/admin-dashboard) is wrapped in a Layout component that enforces authentication state before rendering
- All external embeds (Tableau) are iframed — sandboxed from main app context
- No API keys committed — Mapbox GL access token should be in .env (VITE_MAPBOX_TOKEN), never hardcoded in source
- Dependencies: 65+ packages — supply chain risk is the primary security concern; npm audit should be run before any production update cycle
Explore Indo-Marine-Base
Check out the source code or see it live.